Giuseppe Pulino
 I am a Data Science student
 Skills in:
- Python
- R
- Tableau
- MySQL
Data Science Projects
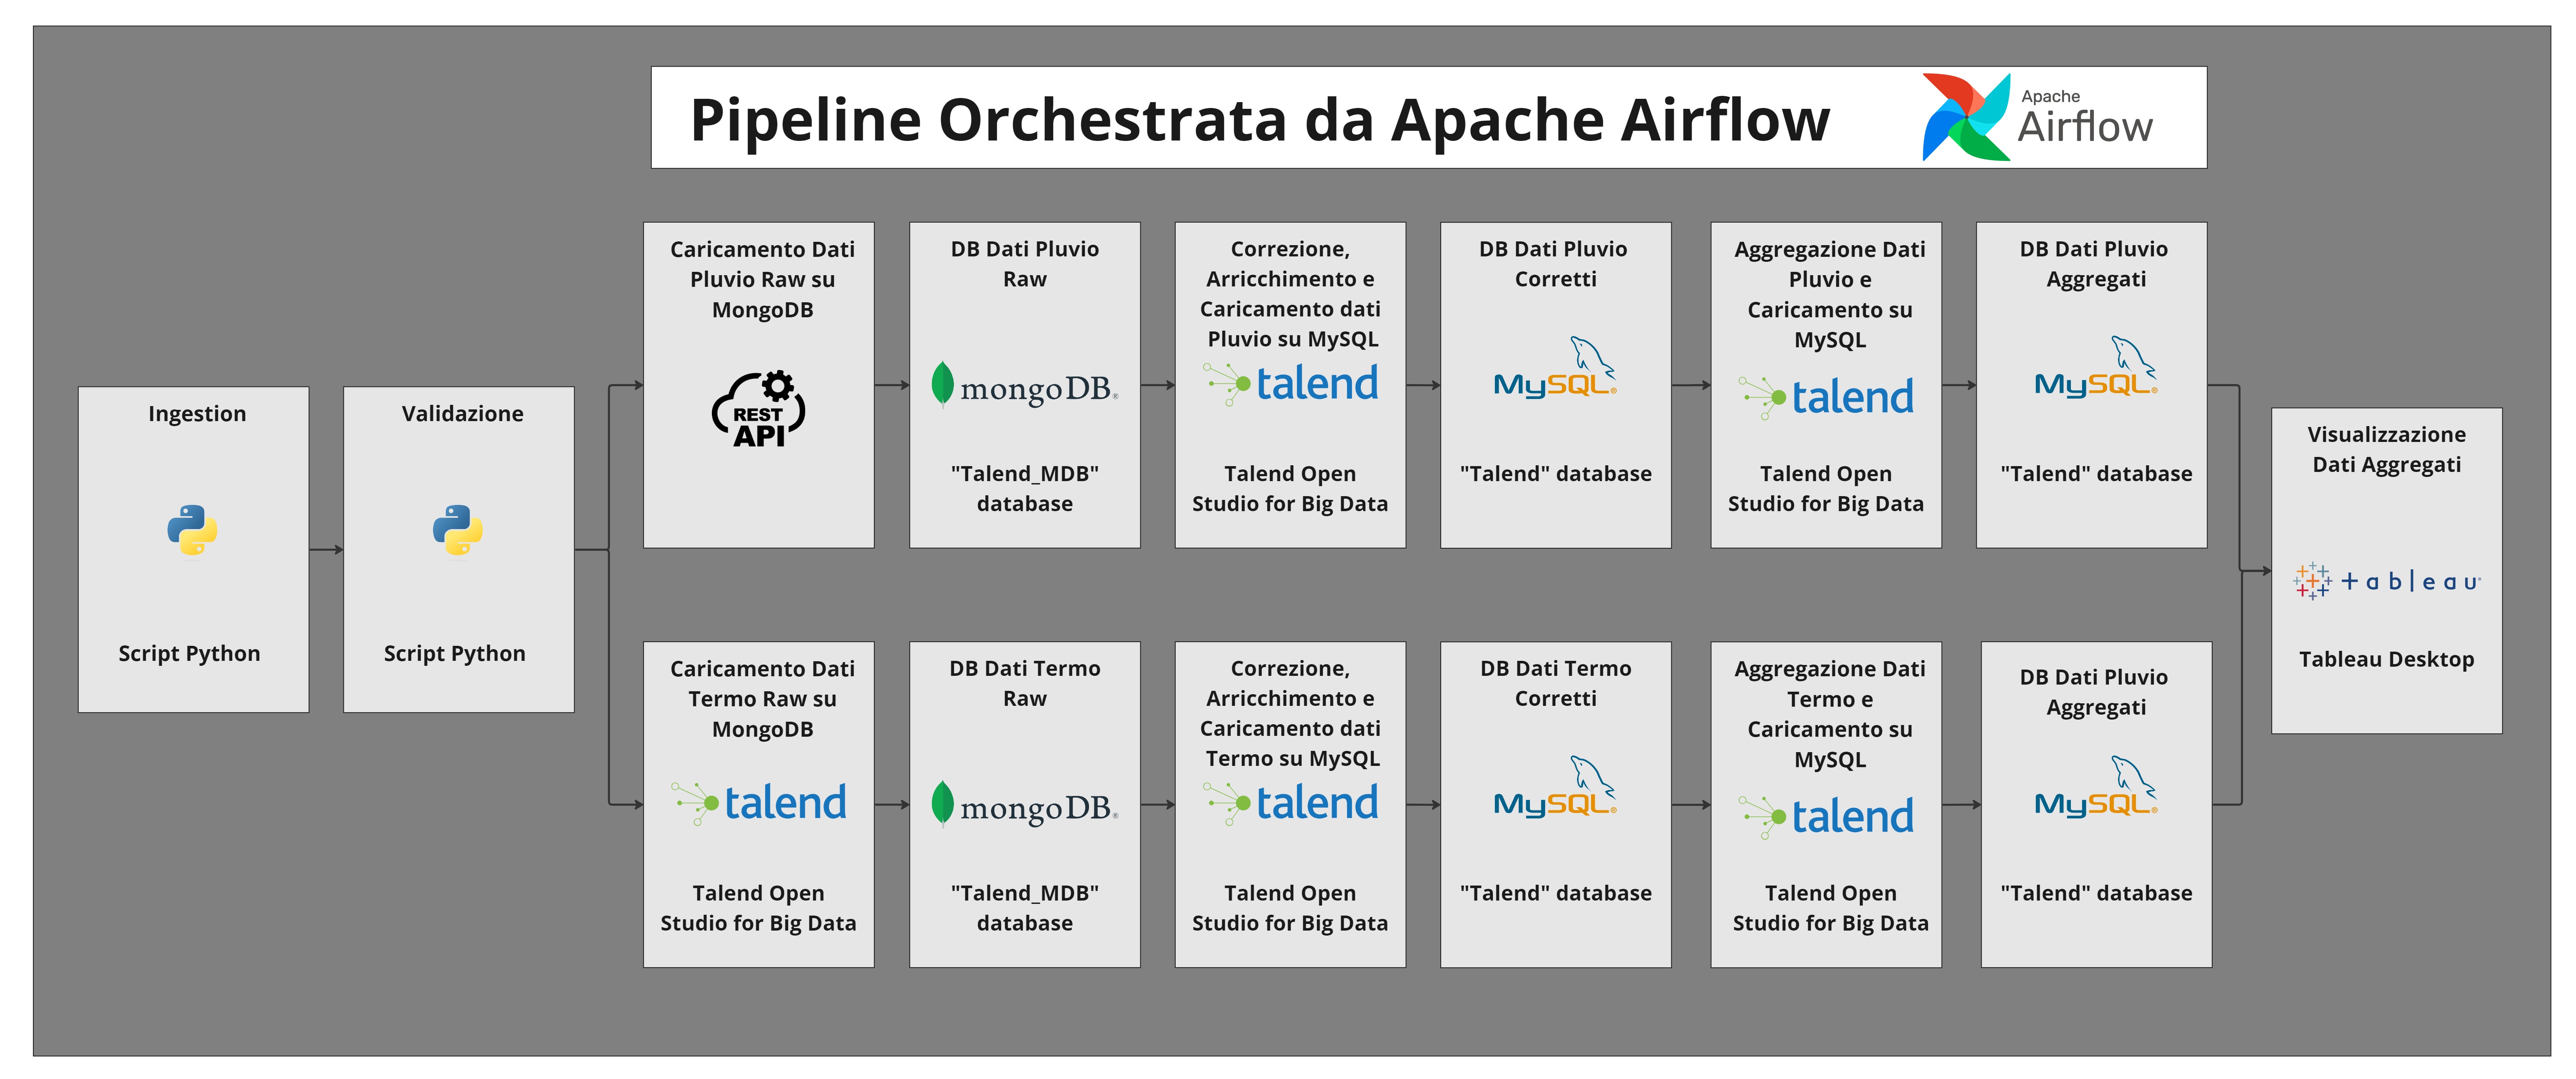
Internship Project 6: Data Pipeline using Talend and Airflow
In this project, the goal was to process weather data from 185 weather stations in Sicily. The data includes precipitation (in millimeters) and temperature (in degrees Celsius). Each weather station generates two CSV files at the end of each day, one for temperature and one for precipitation. The files contain measurements taken at a minimum interval of 5 minutes. The project involved using Talend Open Studio for Big Data and Apache Airflow to design and implement a pipeline.
Architectural Diagram
Project 5: Bottles Synthetic Images Classification
Description[Accademic Project]
The goal of this project is to classify an image containing a bottle among the following classes of bottles training a CNN in Matlab Environment:
- Soda
- Beer
- Wine
- Plastic
- Water
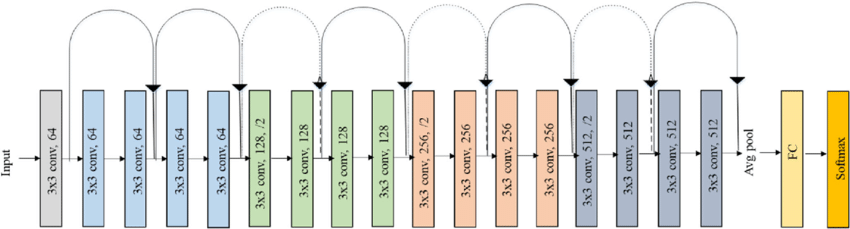
The Convolutional Neural Network that I used is called ResNet-18
Neural Network used ResNet-18
Project 4: Water potability prediction in Python
Project explanation [Accademic Project]
The goal of this project is to analyze and predict, through the use of unsupervised and supervised machine learning methods, the potability of water from data in the ‘drinking water potability’dataset.The project has been divided in 3 parts:
- EDA
- Model-building phase
- Evaluation phase
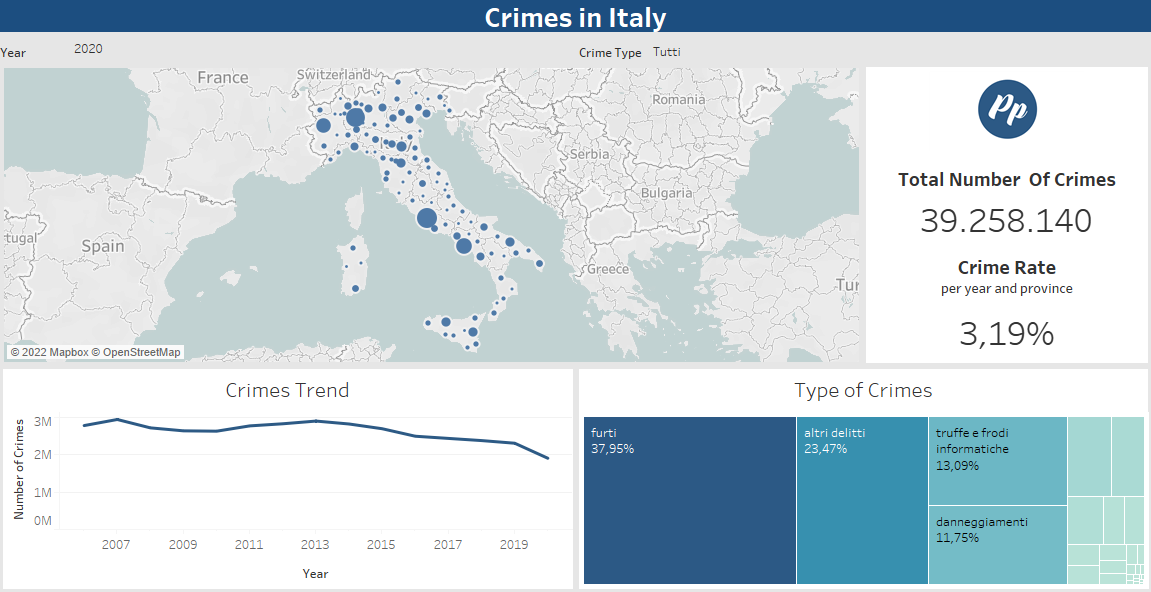
Project 3: Crimes in Italy Dashboard
Description[Accademic Project]
In these Dashboards realized in Tableau Desk, I showed how crimes in Italy are distributed and also how they are related to Unemployment,Economic and Education rates.
The first Dashboard focuses on the distribution of crimes in Italy
See the project to obtain more detail!
Project 2: Soccer Results Classification
Description
Championship used Serie A Year 2021/2022
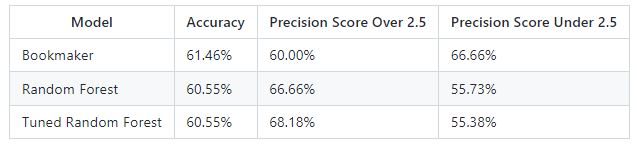
The aim of this project is to try to classify if a game is going to end with a number of goal greater than 2, to carry out this task i downloaded a dataset where are present a lot of features as number of goal,team names and stats related to matches, are also present the odds provided by bookmaker BET365 that can be converted into probabilities and can be used as referencee point ,but my purpose would be beating those odds.
The strategy that I adopted is based on goals scored and goals conceded:
-
I will compute the average goals scored and conceded for each team from all the previous matches
-
and the average goals scored and conceded for each team from the the last n previous matches (that it can be 1 or 2 and so on..)
I would like to find useful differences between the performance of teams in the last n previous games and the performance in the total games, to classify the target
Results
Project 1: Spam email Classification
Description
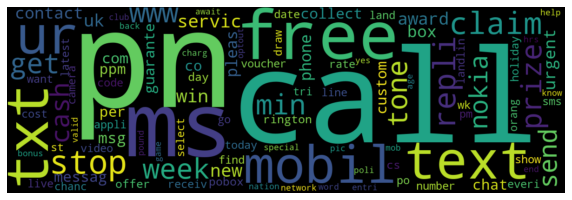
The aim of this project is to classify emails into spam and ham emails.
To do this I used the frequencies method that count how many different words there are in a sentence after that I will choose a number of relevant words.
Here the whole project
Results
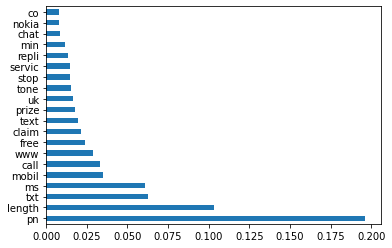
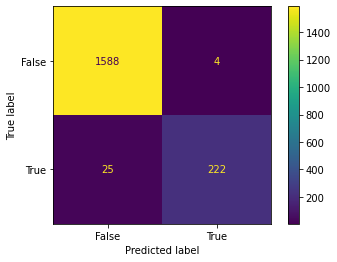
| Feature Importance | Misclassification table |
|---|---|
 |
 |